")
30
May
How Much Does it Cost to Hire a Yellowknife REALTOR?
The cost of hiring a REALTOR® to sell your home depends on a variety of factors including how your home is priced, the state of the market, and the time of year. Some homes are …

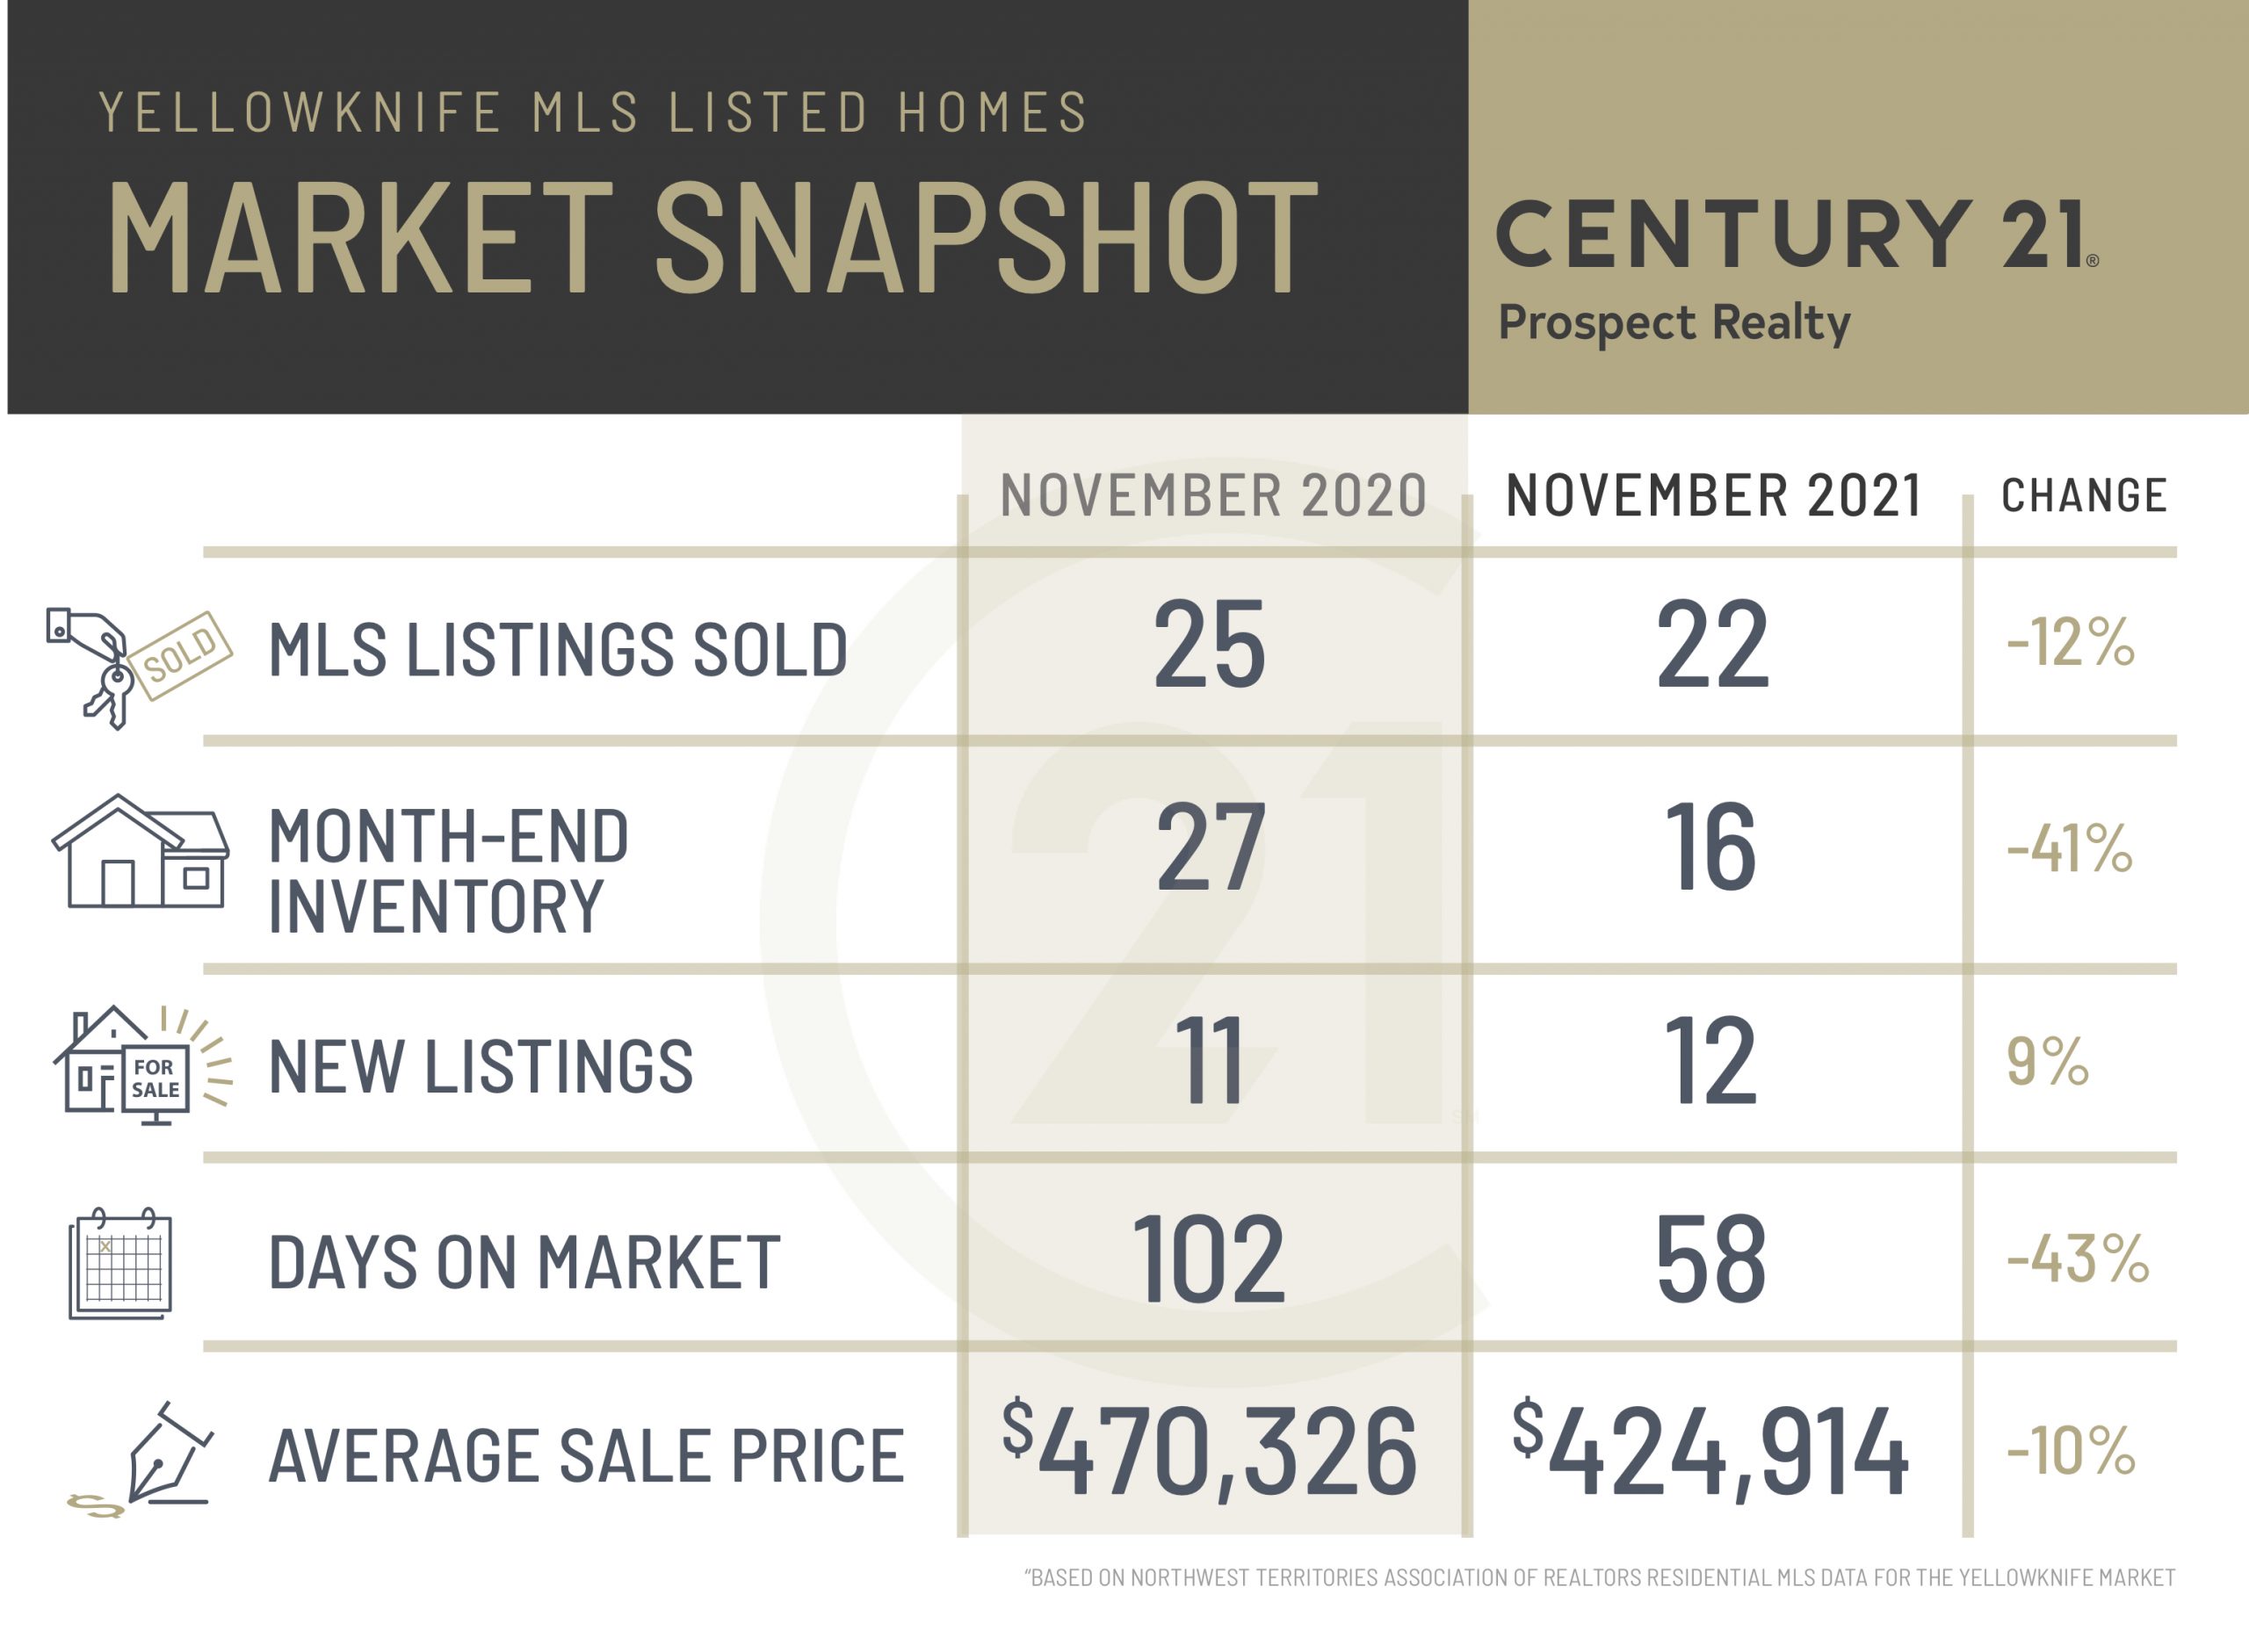 With November 2021 now in the books, we have some new data to report. Activity was down slightly, with only 22 MLS sales in the month. New listings were about normal for this time of year, with 12 new entrants. Average sale price was down by a big chunk, but as we’ve written about before, during the slower months of the year, when there are few transactions, average home price figures are not very reliable. There was an unusually low number of bigger single family homes sold in the month – because there are very few on the market – so the average sale price was low as a result. In a month’s time, when we provide our Year in Review Report, the average sale price data will be much more representative of the actual situation.
We’re trying something new this month. Because the dominant storyline both here and in the South continues to be the low number of active listings at any given time (“inventory”), we thought it would be useful to graph the monthly inventory levels dating back to when we started tracking them, at the end of June 2019. This graph pretty much tells the entire story of why we’re in the situation we’re in.
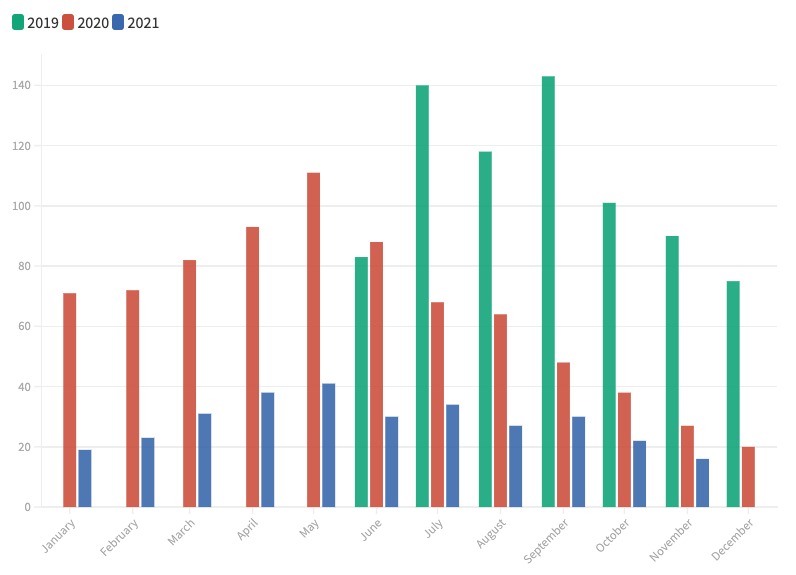
As you can see, back in September of 2019, there were over 140 listings on the market. Things declined steadily to the end of 2019 as they always do, and they began to climb in earnest in the spring of 2020. But then COVID-19 hit in March 2020, and after two months of buyers not being sure what to do next, they started to buy en masse. And our inventory levels dropped through the floor (note the red columns from May to December). There was a slight increase in options available to buyers through May of this year, but a peak of 40 listings can barely be called a peak at all compared to what we’re used to.
And the reason for this is not, as one might think, because people aren’t selling their homes. So far in 2021 we are up over 20% in total MLS transactions compared to 2020. There have been more listing than usual, but there have been more than enough buyers to quickly snatch them up. Where are the buyers coming from? Some from out of the territory but most from within Yellowknife. We’ll go deeper into this part of the analysis in a month’s time.
If you would like to be notified when new listings come on the market, or if you would like a detailed report of which homes sold this month, where they were located, and what the final sale price was, please contact us at prospectrealty@century21.ca.
07
Dec
2021

30
May
The cost of hiring a REALTOR® to sell your home depends on a variety of factors including how your home is priced, the state of the market, and the time of year. Some homes are …

09
Mar
At Century 21 Prospect Realty, we spend a lot of time thinking about ways to improve the home buying process for newcomers to our city. Many of our clients are sent here by their employers …
Adrian Bell is the Designated Representative for the Agent, Century 21 Prospect Realty.
BRIXWORK Real Estate Marketing Inc. All rights reserved.


